Christopher, or most famously known as The ClimateGuy ©, is a weather and climate hobbyist. I am a sophomore high school student from Northern VA and I am aspiring to become a meteorologist. I am very skeptical about man-made global warming. I personally think… read more→

Unhiding the Deceleration in Sea Level
By Christopher
M., founder,
editor, and author.
Follow @The_ClimateGuy
Daily, we are bombarded with ridiculous headlines from news organizations like
the Washington Post, New York Times, and The Guardian.
about potential climate catastrophes. Aside from fake stories about melting sea ice
in the Arctic, to Greenland’s melting ice sheet, and temperature rise scares,
sea level rise lies is probably one of my biggest “pet
peeves” in poorly conducted climate science.
Some of these headlines project anywhere from 15 to 205 feet (Figure 1) of sea level rise by 2100 or earlier, which is totally out of proportion of what sea levels can rise in that span of time.

To juice up their stories even more, they insert photoshopped images (Figure 2) of what coastal cities would look like if their sea level rise scare came true.

However, these stories are nothing new. On September 26, 1988, The Canberra Times reported that the Maldives would be underwater within 30 years thereafter (Figure 3).

So, the Maldives have been underwater since September 26, 2018, right? NO! Not even close! (See Figure 5).

Contrary to their forecasts, sea level around the Maldives is rising at a rate of about 3.52 millimeters (0.14 inches) per year (Figure 6) with a margin of error of +/-0.89 millimeters per year. In order for the land surface of the Maldives to be submerged under ocean water, in other words, to become Atlantis, then sea levels would have to rise about 230 feet (2,760 inches). This means that their forecast was off by only 2,756 inches.

Globally, sea levels have risen eight inches over the past 100 years, which translates to a rate of +/-0.08 inches per year. In other words, that is eight one hundredth’s of an inch per year.
If sea levels were to rise at an even faster rate, such as by a factor of ten or more, it would still be within the natural boundary of where sea levels can rise.
Sea levels have risen by approximately 400 feet since the beginning of the last glacial period (Figure 7), 20,000 years ago (the end of the last glacial was around 11,500 years ago)

Between 15,000 and 8,000 years ago was the time frame in which the sea levels rose the most and the fastest; they rose at a rate of 50 feet per 1,000 years, 6 inches per 100 years, which is around 0.6 inches annually. The current rate, as mentioned before is 0.08 inches per year and eight inches per century.
If we do the calculations, the rate of sea level rise has dropped by nearly 90% since 8,000 years ago.
Sea level rise is not accelerating, it is decelerating.
WORKS CITED
Heller, Tony. “Distinguishing Between Natural And Man-Made Sea Level Rise.” The Deplorable Climate Science Blog, WordPress, 1 Jan. 2018, realclimatescience.com/2018/01/distinguishing-between-natural-and-man-made-sea-level-rise-2/.
Heller, Tony. “Four Metres Sea Level Rise In The Next Twelve Years.” The Deplorable Climate Science Blog, WordPress, 1 Nov. 2018, realclimatescience.com/2018/11/four-metres-sea-level-rise-in-the-next-twelve-years/.
“Live Cam Kuredu Island Resort.” SkylineWebcams, 1 Jan. 5274, http://www.skylinewebcams.com/en/webcam/maldives/lhaviyani-atoll/kurendhoo/kuredu-island.html.
“NOAA Tides & Currents.” NOAA/CO-OPS ODIN – NOAA Tides & Currents, NOAA, tidesandcurrents.noaa.gov/sltrends/sltrends_station.shtml?id=454-002.
Raso, Beatrice. “Cambiamenti Climatici, Spaventose Proiezioni Sull’aumento Del Livello Globale Dei Mari: 15 Metri in Più Entro Il 2300 Se Le Emissioni Di Gas Serra Rimangono Elevate.” Meteo Web, 9 Oct. 2018, http://www.meteoweb.eu/2018/10/cambiamenti-climatici-aumento-mari/1162201/.
Rohde, Robert A. “Post-Glacial Sea Level Change.” Wikimedia Commons, Wikipedia, commons.wikimedia.org/wiki/File:Post-Glacial_Sea_Level.png.
Rush, Elizabeth. “Rising Seas: ‘Florida Is about to Be Wiped off the Map’.” The Guardian, Guardian News and Media, 26 June 2018, http://www.theguardian.com/environment/2018/jun/26/rising-seas-florida-climate-change-elizabeth-rush.
“Threat to Islands – The Canberra Times (ACT : 1926 – 1995) – 26 Sep 1988.” Trove, The Canberra Times, 26 Sept. 1988, trove.nla.gov.au/newspaper/article/102074798.
The Sorry State of Climate Science Peer Review, and Kudos to Nic Lewis
By Roy W. Spencer, Ph.D., meteorologist at UAH. Follow @RoyWSpencer

For decades now those of us trying to publish papers which depart from the climate doom-and-gloom narrative have noticed a trend toward both biased and sloppy peer review research submitted for publication in scientific journals.
Part of the problem is the increased specialization of climate science (and other sciences in general) so that there are relatively few peers who know enough about what they are reviewing to pass expert judgement on it.
Instead, they simply give the paper author(s) the benefit of the doubt. I have been in this position many times when reviewing a paper for publication.
This leads to group-think, as the number of experts in any sub-discipline dwindles.
If the conclusions of the paper support a more alarmist narrative on the seriousness of anthropogenic global warming, the less thorough will be the peer review.
I am now totally convinced of that. If the paper is skeptical in tone, it endures levels of criticism that alarmist papers do not experience.
I have had at least one paper rejected based upon a single reviewer who obviously didn’t read the paper…he criticized claims not even made in the paper.
A recent paper published in what is arguably the world’s most prestigious science journal, Nature, claimed that the oceans have been warming considerably faster than estimates made from actual thermometer measurements, which remain rather sparse even in the Argo float era.
Enter Nic Lewis, who along with Judith Curry has been publishing some of the most thorough estimates of climate sensitivity based upon the observational data and the usual assumed anthropogenic climate forcings (mostly increasing CO2).
Despite not being a credentialed climate scientist, Mr. Lewis immediately identified a significant error in the paper, substantially altering the conclusions, which the authors now acknowledge.
The good news is that this is a case where the error was caught – and admitted to.
The bad news is that the peer review process, presumably involving credentialed climate scientists, should have caught the error before publication.
Read the original article here on Roy Spencer, Ph.D. run by meteorologist Roy Spencer.
U.S. Permanent Drought Update
By Tony
Heller, geologist and founder of The Deplorable Climate Science
Blog.
Follow @SteveSGoddard
Two thirds of the US has had above normal precipitation over the last three years, including nearly half of California.
Thirty years ago, James Hansen predicted a huge increase in drought, and said that droughts hardly ever happened in the 1950’s.
The 1950’s had the most persistent droughts on record, with the US in drought about 50% of the time, not 5% as Hansen claimed. Since then, and particularly since Hansen’s 1988 forecast, the US has been getting and wetter and droughts have become much less frequent. Hansen not only failed to predict the future, but he didn’t know anything about the past either.
The more incompetent and clueless climate scientists prove themselves to be, the more Democrats trust and idolize them.
Read the original article here on The Deplorable Climate Science Blog run by geologist Tony Heller.
Halloween Scare: Climate Cherry Picking At NBC 4
By Christopher
M., founder,
editor, and author.
Follow @The_ClimateGuy
NBC is not new to spreading false news about climate change, in fact they write articles about it almost every day, although the Washington (Com)Post‘s Capitol Weather Gang probably holds the record.
Now, I am well aware that the meteorologists working at the NBC affiliate in Washington D.C. are on Al Gore’s “Global Warming Train,” as I have had a few debates with them before on Twitter, and it gets ugly (not on my behalf), but I never thought that they would go to the point where they would cherry pick a starting date for their temperature graphs.
On October 31, 2018, Halloween for Pete’s sake, I was watching NBC 4 to catch the weather only to see that Penn State graduate Amelia Draper was using her 2:30 talk time to talk about climate change, rather than doing the weather.
She even let us know on her Twitter page, saying that
“…Octobers are warming in much of the country. Of the 244 cities analyzed, 82% have warmed at least 1°F in the last half-century, while only 2% have cooled 1°F or more.”
👻 Expect a high tomorrow of 72 with mid 60s to 70 for trick or treating, so comfy.
According to @ClimateCentral Octobers are warming in much of the country. Of the 244 cities analyzed, 82% have warmed at least 1°F in the last half-century, while only 2% have cooled 1°F or more pic.twitter.com/9Oz5MfcouT
— Amelia Draper (@amelia_draper) October 30, 2018
She goes on saying that October 31 maximum temperatures in Washington D.C. have warmed 1.2°F since 1970, which is true, but her assessment is completely skewed so that she doesn’t look at the entire picture.
If you start your graph in 1880 (Figure 1), like most people would do, then we still see a warming trend, but please keep in mind that the 1880s through the 1910s were at the end of a global cold spell, not to mention that the weather station moved to Ronald Reagan International Airport in 1947, which is a warmer spot than the original location.
The warmest October 31 in Washington D.C. was in 1950, with a high of 85 degrees. The coldest October 31 in Washington, was back in 1925, with a high of 41; in fact, we got 2.5 inches of snow on that date.

Figure 1. October 31 maximum temperatures in Washington D.C.; 1880 – 2017.
In 1946, it was 84 degrees, and it has been 80 on multiple dates, including 1919, 1961, and in 1974. In fact, it has been 44 years since we have had an 80 degree Halloween in Washington D.C. And out of the top 10 (some are tied) warmest Halloweens, only two have occurred since 2000, with 2004 being 79 degrees and 2006 at 73. 10 of the warmest Halloweens (counting the tied ones) occurred prior to 1951. See Figure 2.

Figure 2. Top 10 warmest Halloweens in Washington D.C. (some are tied).
Amelia, used Climate Central‘s graph, in which they start their graph in 1970, which was the second coldest decade of the twentieth century, so of course if you start your graph there, you are going to get a warming trend. That is a no brainier.
Another problem is her assessment is when she explained why it was 69 degrees on Halloween 2018. The real reason was because of the atmospheric conditions and the upper air patterns in the atmosphere at the time. It had nothing to do with your SUV’s CO2 emissions.
The fact that it hasn’t been 80 degrees on Halloween in Washington in over 44 years tells me that Climate Central has a political agenda of some sort and people are too clueless to believe anything they say.
The global warming scare gets fed by money. If there is nothing scary (and spooky)
going on, then funding gets cut. You got to follow the money trail on these
scientific political issues. NBC 4‘s slogan is
“Working 4 You,” but what Storm Team 4 did the other day; they
were certainly not working for you.
WORKS CITED
Washington D.C. (any city) temperatures can be found here.
- Click the link above
- Click “single station.”
- Click “almanac data for a day.”
- Choose your date.
- Click “station selection.”
- Change your “CWA” to change the area.
- Choose your city within that “CWA.” (above CWA box).
Winter Forecast 2018 – 2019 | FirstWatch Weather
By Christopher
M., founder,
editor, and author.
Follow @The_ClimateGuy
It is this time of year again; the days are getting shorter, the nights are getting longer, growing season is almost over, and yes, it is getting colder. Yes indeed, winter is coming!
So, what can you expect this upcoming winter? How cold? How warm? How much snow? How wet? How dry? All of these questions will be answered.
KEY FACTORS:
- ENSO (El Niño Southern Oscillation)
- High Latitude Blocking + NAO and AO
- Analogs
- Solar Activity
EL NIÑO SOUTHERN OSCILLATION
The first thing our FirstWatch Weather team did was to look at the global sea surface temperatures. Right now, they are looking slightly above average, but that is irrelevant. The main area of focus is in a region of the equatorial Pacific known as Niño 3.4.
You may have heard about El Niño and La Niña over the years. ENSO refers to the recurring natural phenomena which is a part of a large global atmospheric variation. The “Southern Oscillation” refers to the changes in sea level air pressure patterns in the South Pacific, between Tahiti and Darwin, Australia. When El Niño occurs, the average air pressure is higher in Darwin, than in Tahiti, and when the air pressure is lower in Darwin, than in Tahiti, we are in La Niña. The change in air pressures in the South Pacific and water temperature in the Equatorial Pacific are related. El Niño simply refers to the water temperature in the Equatorial Pacific Ocean. When the conditions are warmer than average, we call this El Niño, and cooler for La Niña.
Currently, Niño 3.4 is about 0.5°C above average in terms of sea surface temperature, which means we are in an El Niño phase. However, there are different types of El Niño’s (and La Niña’s). There are weak, moderate, strong, and very strong ones. Since the Niño 3.4 region is 0.5°C above average, that means we are in a weak El Niño, pushing toward moderate, which is referred to as a Modoki El Niño in meteorology. It is also worth noting that we also know we are in a Modoki El Niño because the waters right off the coast of South America are cooler than average.
So, what does a typical El Niño look like in terms of weather patterns? Well, for the northwest and upper northeast U.S., temperatures are generally warmer than normal with drier than average conditions, while temperatures in the south and southeast are cooler with wetter than average conditions.
However, us FirstWatch forecasters think that this map is total garbage in terms of its projected temperature due to the warm phase of ENSO. We have come to agreement that El Niño simply increases the amount of evaporation, thus causing snowy winters for the eastern U.S. This increase in evaporation likely has little or no effect on temperatures if and only if it is a weak, Modoki, or moderate El Niño. However, it is important to note that almost every single Modoki El Niño has resulted in cold winters; remember 2002-2003 and 2009-2010.
HIGH LATITUDE BLOCKING
Another particular area of focus in the Pacific is the North Pacific, right off the coast of Alaska. As you can clearly see, the temperatures there are well above average, which is signalling high latitude high pressure blocking. High pressure blocking in high latitudes is a very good sign of a cold winter to come, especially with an Alaska block and a Greenland block. It looks, as of right now, that an Alaska block is forming and a Greenland block is trying to form. If this does happen, the jet stream branches southward into the states as well as plunging south in Europe, sending them into a deep freeze as well.
Furthermore, with this high latitude blocking, the North Atlantic Oscillation (NAO) and Arctic Oscillation (AO) turn negative, which typically has produced the same result; Arctic outbreaks and snowstorms for the U.S. and Europe.
ANALOGS
Another important factor we looked at was analogs, which are historical references to past seasons to see how they matched up with the current season, in order to predict the winter (or any other season) ahead.
This season’s closest analogs are 1956-57, 1969-70, 1993-94, 2002-03, 2009-10, and 2014-15. These winters turned out to have a warm fall preceding the winter that followed, which is what we have seen so far this year, in terms of temperatures. Generally, over these particular years, the eastern two thirds of the U.S. saw very cold temperatures and wetter conditions, while the west saw above average temperatures and drier conditions.
SOLAR ACTIVITY
Solar activity is a very important factor for the upcoming winter, in our opinion, as the Sun is the main driver of our climate, NOT CO2.
We are currently in a solar minimum, which means the Sun is at the bottom of its 11-year solar cycle, where the sunspots disappear and the magnetic poles flip. Solar minimums tend to have a cooling effect on the Earth and usually aid in forming very cold and snowy winters by producing deep long-wave patterns in the jet stream.
It is important to note that while solar minimum tends to produce cold winters, such as 2002-03 and 2009-10, there are temperature extremes on both sides of the jet stream. There is no explanation for the cause, but it is something that has been observed and stayed consistent over the years, which means that there will be warm-ups every now and then, and I wouldn’t rule out a mid-January thaw.
It is also interesting to note that many of the analog years we talked about earlier took place during solar minimums, so there is definitely something to this.
THE FINAL FORECAST
Overall, we think the U.S. is going to have a colder than average winter. The eastern two thirds should have the coldest conditions with temperatures averaging about two to four degrees BELOW average, whereas the western third of the U.S. will have temperatures between one and three degrees above average, especially the Pacific Northwest.
Snowfall amounts will vary, but all in all, we think it will be very snowy along the east coast and even possibly the Midwest. The south and southeast may also have snowier than average conditions. The west, however, will stay relatively dry, especially in the Pacific Northwest. California does have a chance of being above average in terms of precipitation, but it is borderline.
Please comment below and I can give you a detailed forecast for YOUR city!
Al Gore Up to His Old Tricks Again: ‘We’re Running Out Of Time’ [on Global Warming]
We should have expected already, that nonsense from the leading climate doomsayer, Al Gore, would return sometime soon. That time has come and Mr. Gore is out of hiding and is back at his old tricks again…
Yesterday, Sunday, October 7, he warned us that the globe was “running out of time” to stop global warming from causing a catastrophe, in a statement published after the United Nations released their IPCC climate report Sunday evening.
My statement on the latest #IPCC Special Report: https://t.co/BtWuyzH1PR pic.twitter.com/DAsf5fgHBj
— Al Gore (@algore) October 8, 2018
The IPCC released their report about keeping global warming policies in accordance with the Paris accord, which President Trump thankfully got us out of two summers ago.
Gore’s message is expected to be restated at the UN Climate Summit in December, which is meant to send a “dire” warning to the people of the world about a future “climate catastrophe.”
The IPCC, wants to keep “global warming” from causing a 1.5 degree Celsius rise in global temperatures by 2100 and that emissions need to peak around 2020, fall 45% below the 2010 levels by 2030, and decrease 100% by 2050.
In other words, the IPCC wants to destroy the energy industry and discontinue coal and other energy sources in replacement for solar and wind power. However, the IPCC used a little common sense for once and stated that the transition of energy sources from one to the other would cost billions of dollars with a carbon tax of $27,000 per ton by 2100.
And unfortunately, we know what happens when we use wind power… It kills animals.
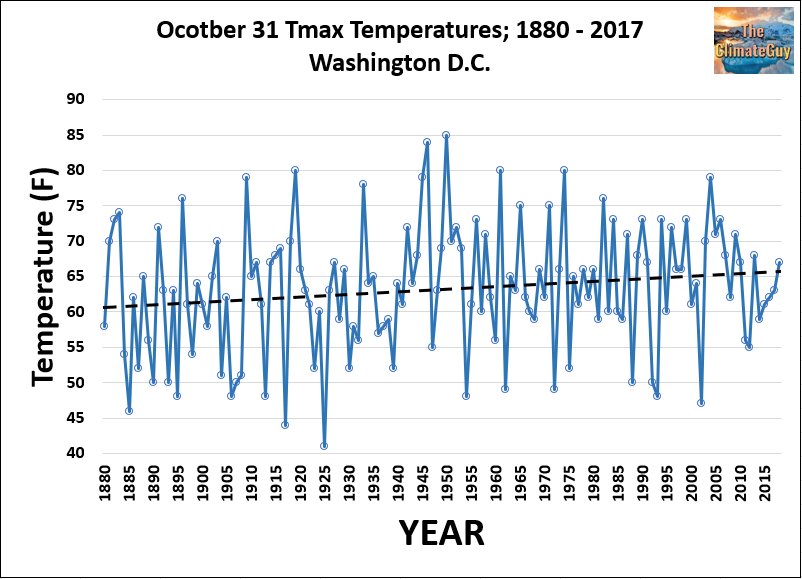
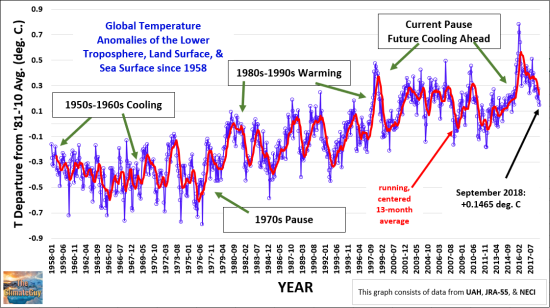
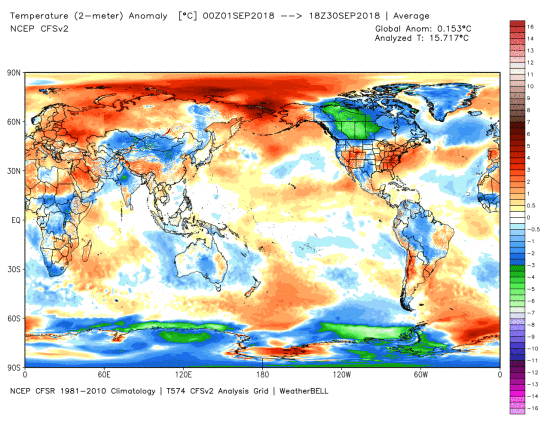
However, this is where the wheels fall off the wagon. Had the IPCC used a little more common sense, they would understand that according to my months and months of research and data searching, global temperatures have only risen approximately 0.3 degrees Celsius since 1880, and that the 1930s and 1940s were just as warm as the past two decades globally, and that there is 100% natural variability in the climate system on multi-decadal and century time scales.
In fact, in the IPCC‘s first climate report, in 1990, they showed us a graph of proxy data (instrumental 1880-1990) for global temperatures dating back over 1,000 years. They show that the “Medieval Warm Period” was global AND that it was warmer than today!
So, this tells me that they are lying about a 1.5 degree rise by 2100 and that they just pulled this out of thin air.
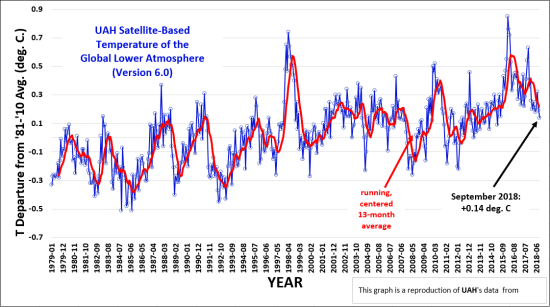
I contacted meteorologist Dr. Roy Spencer from UAH, and asked him if he could send me the dataset for the temperatures over the past 2,000 years. He kindly responded, and sent me the link to make the graph below. And according to the data, global temperatures have been falling for the past 2,000 years and there have been warmer times with less CO2.
And if we look at one of the many geological records temperature vs. CO2, dating back 600 million years, there is NO linkage between CO2 and temperature.
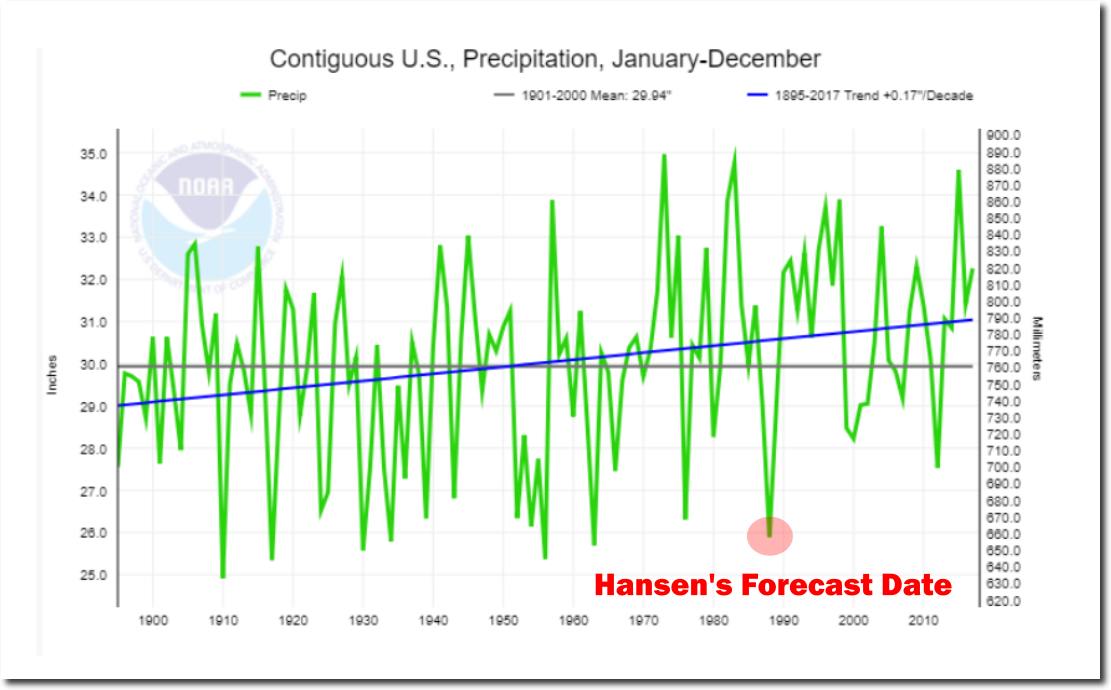
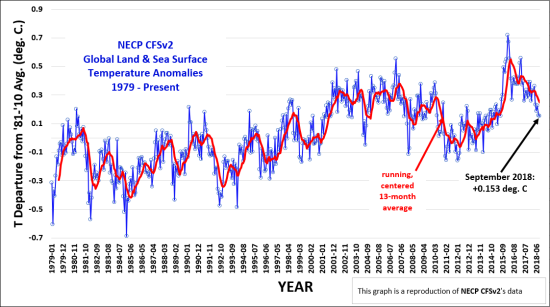
The IPCC would also benefit from looking at the emission data from the EPA. While fossil fuel emissions have to no surprise increased over the 
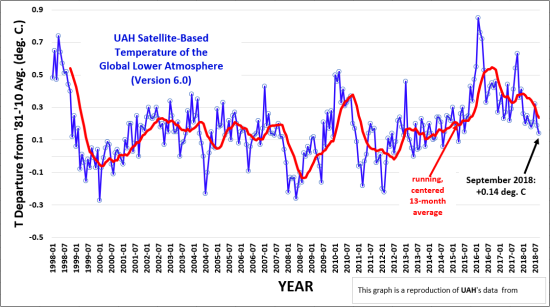
past 28+ years, the global temperatures have been relatively steady since 1998. This once again is proof, that CO2 is NOT the climate control knob!
Gore has repeatedly attacked President Trump and the administration saying that they are ‘stooges of the fossil fuel industry’ and that he should resign because he is “unwilling” to fight the [fake] global warming crisis.
Climate prophets like Al Gore literally have no clue what they about. He isn’t is not a scientist and does not have any scientific background.
I quite frankly don’t know why people continue to listen to Mr. Gore anymore, 
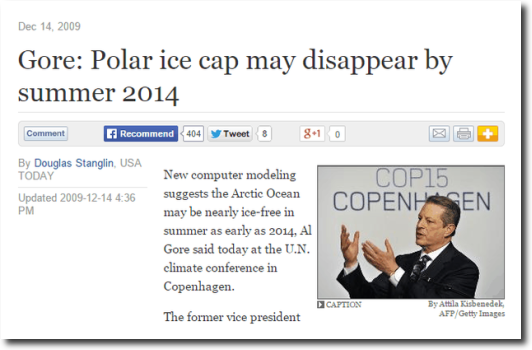
considering he has made numerous failed climate change predictions, like this one about Arctic sea ice melt from 2009:
“Gore: Polar ice cap may disappear by the summer of 2014,” USA
Today
quotes. “New computer modelling suggests the Arctic ocean may be
nearly ice-free in summer as early as 2014, Al Gore said today at the U.N.
climate conference in Copenhagen.”
However, if we look at the actual data from NOAA, there has been no trend in Arctic sea ice extent for ten years, and volume is actually at its highest amount in ten years, according to DMI.
It is important that we educate the younger generation (my generation) about the corruption of climate science. School teachers also need to be informed about this so they don’t mistakenly brainwash their students into panic mode about something that isn’t even an issue! It is also important that we do our best to put this nonsense to bed and stop the gibberish.
Healthy debate is what keeps science thriving and I am open to everyone’s ideas, but there is a point where things get so ridiculous, that a pre-schooler can point them out. There is a lot of uncertainties about climate and why it changes due to natural reasons, but the hysteria of climate science, the peer pressure of climate science, the politicization of science, and the “sausage making” going into climate science is disgusting and needs to be stopped as soon as possible…
WORKS CITED
“Al Gore: ‘We’re Running Out Of Time’ On Global Warming.” The Daily Caller, The Daily Caller, dailycaller.com/2018/10/08/al-gore-global-warming-un/.
“Climate Change Indicators: Global Greenhouse Gas Emissions.” EPA, Environmental Protection Agency, 17 Dec. 2016, http://www.epa.gov/climate-indicators/climate-change-indicators-global-greenhouse-gas-emissions.
Enloe. “Sea Ice and Snow Cover Extent.” National Climatic Data Center, http://www.ncdc.noaa.gov/snow-and-ice/extent/.
“Hansen Confirmed The MWP In 1981.” The Deplorable Climate Science Blog, realclimatescience.com/hansen-confirmed-the-mwp-in-1981/.
“Index of /Arctic/Icethickness/Anim/plots_uk.” Ocean and Ice Services | Danmarks Meteorologiske Institut, ocean.dmi.dk/arctic/icethickness/anim/plots_uk/.
Ipcc. “#IPCC Working Group Co-Chair @Valmasdel: Net Zero Emissions of CO2 Must Reach Zero by 2050. That Is the Most Important Finding of the Report. We Are at a Crossroads. What Happens between Now and 2030 Is Critical. #SR15 #Climatechange Pic.twitter.com/y8GGBJRRqG.” Twitter, Twitter, 8 Oct. 2018, twitter.com/IPCC_CH/status/1049113197523828737.
“The Atmosphere.” The ClimateGuy, 9 Oct. 2018, iceage2050.com/the-atmosphere/.
“Windfarms Kill 10-20 Times More than Previously Thought.” Save the Eagles International, savetheeaglesinternational.org/new/us-windfarms-kill-10-20-times-more-than-previously-thought.html.
Bismarck, ND Nearly Misses Setting All Time Cold Records
The northern tier of the U.S. has seen its fair share of cold weather over the past two weeks. Temperatures have been averaging about six degrees colder than average for the past 14 days!
Despite some of the record heat seen in the Southeast, the extremely cold conditions prevailing across most of the Northern Hemisphere, by far outweigh what Florida has seen.
Bismarck, North Dakota is no exception, as they have been dealing with one of their coldest autumns on record, averaging about five degrees below average.
Maximum temperatures on September 30, reached 43 degrees, which was just ONE degree above the record low maximum of 42 set 136 years ago in 1882! And if that isn’t good enough for you, October 4 also saw a maximum of 40 degrees, which nearly tied 38 set 120 years ago, in 1898. The minimum temperature fell to 23, which was shy 6 degrees of the record low minimum of 17 degrees set back 30 years ago, in 1988. The next day, October 5 saw a maximum of 40 as well, which was just two degrees above the daily record of 38 set in 2005.
Yesterday, October 6 reached a maximum of 40 degrees, according to the National Weather Service. That fell four degrees short of the all time record low maximum temperature of 36 for the date set back in 1982.
Today’s temperatures were forecasted to climb to 38 degrees, however, it only got to 37, which tied with 1925 for the second lowest maximum temperature for October 7.
Data from NOAA shows that the all time COLDEST maximum temperature for this date was 31, which was set 72 years ago in 1946.
In fact, average October 7 temperatures in Bismarck have been declining since 1874. Daily maximum temperatures have SLIGHTLY risen since 1874, but minimum temperatures have declined by about three degrees over the past 144 years! On this date in 1920, it was a blistering 91 degrees! These temperatures do not tend to happen this late in the year anymore in Bismarck.
WORKS CITED
WeatherBELL Models | Premium Weather Maps, models.weatherbell.com/temperature.php.
“Acis.org.” Acis.org, xmacis.acis.org/.
“Winter Weather in the High Plains.” WeatherNation, http://www.weathernationtv.com/news/winter-weather-in-the-high-plains/.
THE Great Global Warming “Pause”
BETWEEN the start of 1997 and the end of 2014, average global surface temperature stalled. This 18-year period is known as the global warming “pause” or “hiatus” and has been the subject of much research and debate in peer-reviewed scientific journals.
THE rise in global temperatures that alarmed climate campaigners in the 1990’s had slowed so much that the trend was no longer statistically significant. This despite one-third of Man’s entire influence on climate since the Industrial Revolution occurring since February 1997.
THE pause took a pause during the 2015/16 super El Niño which was the strongest such event in recorded history and helped to make 2015 and 2016 the warmest years in the modern warm period. However, 2017 witnessed the biggest drop in global temps in recorded history, seen across most data sets, bringing temps back inline with 1997-2014 averages, rendering “the pause” alive and well, to date.
THERE…
View original post 2,789 more words
Global Temperature Update – September 2018 | 0.1465°C
UAH‘s Version 6.0 of the Global Average Lower Tropospheric Temperature Anomaly for September 2018 was 0.14°C above the 1981-2010 30-year average, which was down 0.05°C from August 2018 (0.19°C). Last month was the coolest month since April of 2015 and the coolest September in ten years.
The long-term linear temperature trend since January 1979 remains at +0.13°C per decade, but there is a trend of +/-0.01°C for the past 20 years; since 1998.
The NECP CFSv2 model off of WeatherBELL Analytics L.L.C. shows September 2018’s global temperature anomaly for the land surface and ocean at 0.153°C above the 1981-2010 long-term average, down 0.003°C from August 2018 (0.159°C).
Overall, when the lower troposphere, land and sea surface temperatures are averaged, they globally averaged 0.1465°C above the long-term average, down 0.028°C from August 2018 (0.1745°C). The graph below shows a cooling trend during the 1950s and 1960s, which followed the warm spike of the 1930s and 1940s. After the cooling, was a ten-year pause in global temperatures during the 1970s, and during the 1980s and 1990s, we saw a warming trend. Since 1998, we have seen a 20-year pause in global temperatures, and as of now, it appears that we are headed into another prolonged cooling period starting NOW and accelerating in 2021.
Particular areas of interest were North America, Australia, South Africa, South America, Southern Asia, and Antarctica, which featured abnormally low temperatures. Antarctica and Canada were exceptionally cool, averaging about 3 to 5°C cooler than average. The Arctic on the other hand was abnormally warm, averaging about 1.5°C above average, but this can be attributed to cyclically warmed oceans due to the current positive phase of the PDO. It is also worth noting that the United Kingdom had their coolest September in over 20 years.
WORKS CITED
WeatherBELL Models | Premium Weather Maps, models.weatherbell.com/temperature.php.
“Books.” Roy Spencer PhD RSS, http://www.drroyspencer.com/2018/10/uah-global-temperature-update-for-september-2018-0-14-deg-c/.
Maue, Ryan N. Models 3.0 | Wx.graphics | Weather.us, lab.weathermodels.com/models/temperature/jra55_temperature.php.